An effective website navigation scheme not only improves usability but also supports content analysis. Using a topic-driven navigation, you can gain insight into which topics are most popular and, thus, which valuable topics you can revisit or expand upon for new blog posts.
A common blog feature is to list links to blog post categories and tags. When users browse these category pages, they’re informing us about topics that interest them (and consequently, when they ignore certain links, ones that don’t).
In Google Analytics or other analytics tools, evaluate page views for your category (topic) pages.

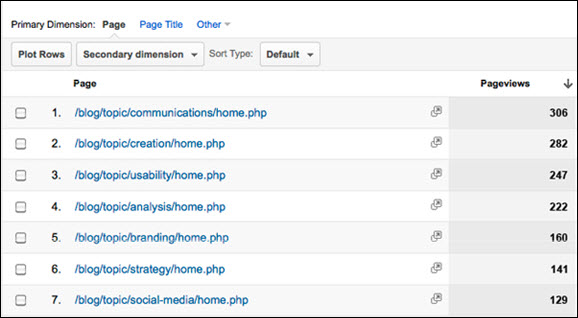
Top page views for topic pages.
In the example above, communications is the leading topic for this blog, followed by creation, usability, and analysis. This is a good place to start in understanding what topics interest your users. Conversely, if other categories have relatively low page views, these may be topics that don’t resonate with your audience and perhaps shouldn’t take priority over other more popular topics.
As with categories, also evaluate the popularity of blog tags. While category pages give you an idea of the broad topics users find interesting, tag pages give you insight into more specific areas of interest.
Category and tag page metrics are general and shouldn’t be taken at face value. Instead, use them to start your research. In the example above, strategy could be toward the bottom of the list because of the placement of the link on the page or because the keyword is inappropriate. If posts are more popular than the category they fall under, you may be using the wrong keyword to describe the topic.
After using this method to uncover potentially valuable topics, you can dig deeper with some of the following methods to help validate your insights. You can also then use traditional metrics such as bounce rate and time on page to help answer more specific questions, such as “Do people who view this topic page find what they are looking for?”
Tip: Configure blog permalinks for easy segmentation. To evaluate category and tag pages, it helps to create a web address structure that supports segmentation. By including topic or category in the web address, you not only provide a descriptive web address for users, you also enable easy segmentation of these pages for analysis.
Top-performing blog posts
Viewing top-performing pages gives you insight into more specific topics of interest on a per-post basis.
Sort blog pages by page view. Take note of the topics, including related category and tag pages, and pay particular attention to combinations of topics. You may, for example, find that posts covering both communication and social media are very popular.
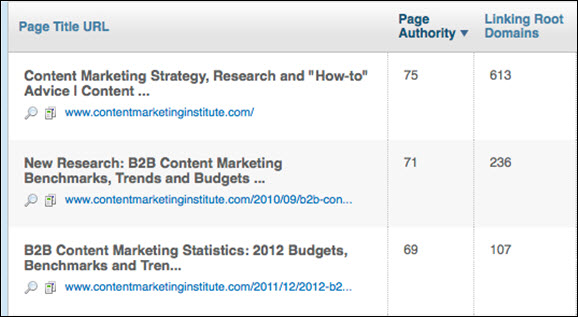
Open Site Explorer by SEOmoz can help you dig deeper through evaluating top-performing pages by search engine authority, inbound links, and social media shares (with a Pro Subscription). Discover which posts and topics rank well in search results (i.e., those that are most referenced by external sites) and which are most share-worthy.

Top two CMI blog posts, sorted by page ranking authority on Open Site Explorer.
Search (internal and external)
When visitors use the search box on your website, they’re again telling you what topics interest them most right now.

Internal site search.
However, visitors don’t always know the right search terms to use, so don’t take search terms completely at face value. Dig deeper.
In your analytics tool, view individual internal site search terms to evaluate whether the search results match the inquiry (i.e., does the user find what she or he is looking for?). This can be measured, in part, by whether visitors click on the search results or choose to leave your site and abandon their search.
The same goes for external organic search from Google and other search engines. What are the top topics (keywords) driving traffic to your site? This approach is focused on prospective readers. View search terms to learn what topics are attracting new visitors. Where are the opportunities for increasing your readership with new, relevant content?
For this exercise, focus less on the exact search terms and more on the topics they relate to. What topics are people searching for?
Evaluate referral traffic by topic
In my experience, referral traffic is a metric that is often overlooked. Yet, it provides valuable, dual insight, revealing details on who your readers are as well as on which topics they care about most.
Who is referring traffic to your website? Look past the common referring websites (Facebook, Twitter, affiliates, etc.) and note sources that are new or different. Who are they? What is their business? What topics do they cover? Go for the long tail. Dig deep to discover sites that don’t refer to you often but have shown an interest in your content.
Which blog topics are referrers linking to? Once you have a sense of who your referring readers are, discover what content they are looking for. View top blog posts by page views and referring websites to find out which of your blog topics your readers are commonly linking to. What are new referrers linking to? More importantly, what referring links do people click on most frequently?
Outgoing traffic
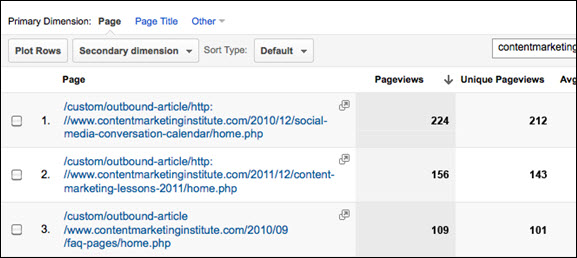
Track outgoing links to learn what external resources and related topics interest your readers. By default, most web analytics applications, such as Google Analytics, don’t track outbound links, but you can tag them manually or use third-party plug-ins (such as Google Analytics for WordPress that will auto-tag outbound links so that you can track them.

Outbound links to CMI blog posts.
Again, pay attention to topics. What external websites do your readers find desirable? Do those websites cover topics that would be valuable and appropriate for your readers?
Comment rate
User engagement is an important benchmark for evaluating content quality — and one of the most effective ways to measure engagement with blog content is comment rate. Find out what percentage of readers comment on your blog posts. But don’t stop there. Look at the comment rate by topic. What topics resonate most with your readers?
Coupled with some of the aforementioned methods of evaluating popular posts, comment rate by topic can help you understand what topics your readers are most excited about.
Sharing rate
While you are evaluating comment rate, also take note of what percentage of readers share your posts via Twitter, Facebook, LinkedIn, Google+, email, and other social platforms. What blog categories and tags do users share the most? Sharing rate can speak to the caliber of your topic. For example, a big retweet number gives your topic a high qualitative value, not just bragging rights.
Finding inspiration
It can be hard to find inspiration when you sit down to write a blog post. You wonder what new content will attract, inform, engage, and retain your readers. Fortunately, many of these insights are sitting right in front of us.
While web analytics is not a fail-safe method for evaluating user needs and intent, it does provide a great starting point. To learn more, you can follow up with formal or informal qualitative analysis, such as user surveys or feedback gathered through your communication channels.
With a clearer idea of your readers’ interests, you can develop a running list of valuable topic ideas. And, better yet, you can say goodbye to writer’s block.


